Multiplex IHC
Quantify expression of up to five brightfield stains in any cellular compartment - membrane, nucleus or cytoplasm.
With unmatched ease-of-use, scalability, and powerful analytic capabilities, research, pharma and healthcare organizations worldwide are using HALO® from Indica Labs for high-throughput, quantitative tissue analysis. Spend less time learning the software and more time analyzing your research. The intuitive software design enables analysts at all levels to quickly learn and utilize the system. A comprehensive range of purpose-built HALO modules simplify the analysis workflow so researchers do not need to "build" algorithms from scratch.
For Research Use Only. Not for Use in Diagnostic Procedures.
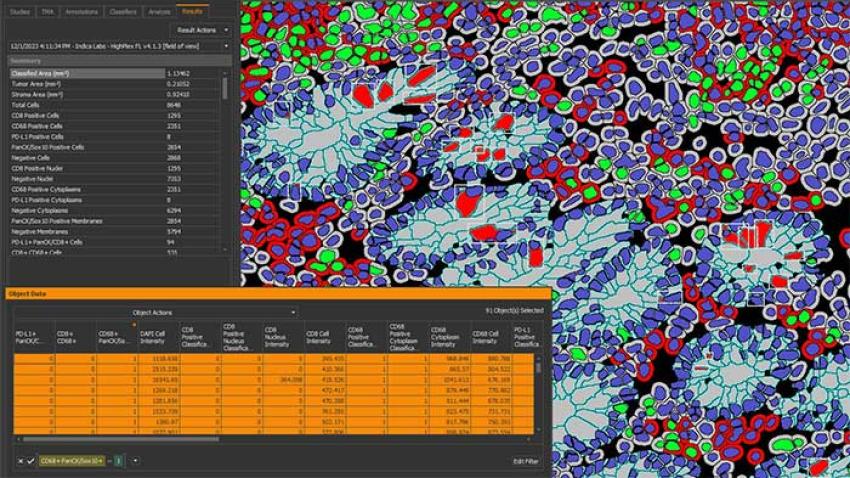
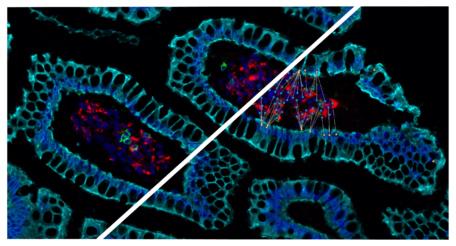
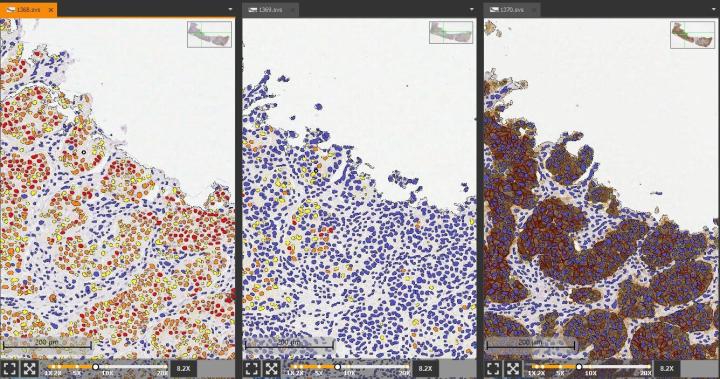
HALO reports morphological and multiplexed expression data on a cell-by-cell basis across entire tissue sections while maintaining an interactive link between cell data and image. Sort and filter cell data to mine millions of cells while also visually assessing cell populations in the context of tissue architecture, leverage interactive markups to understand colocalization and explore combined phenotypes, and define custom analysis outputs.
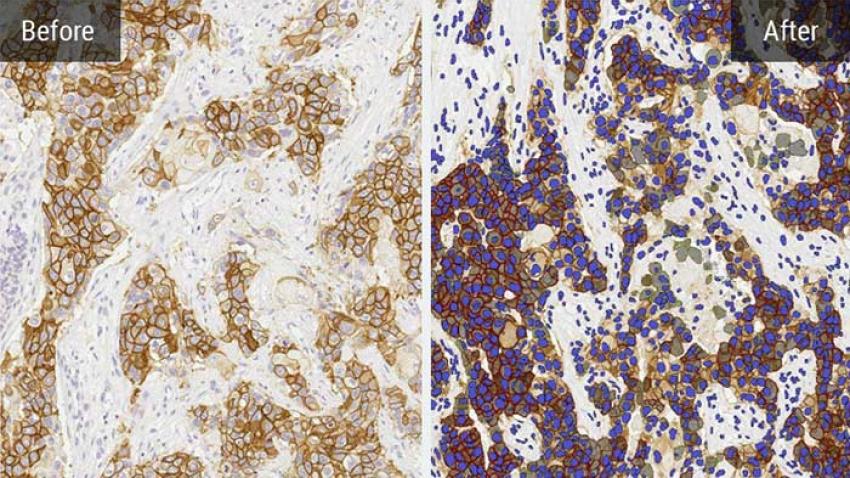
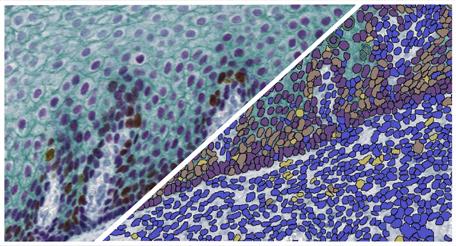
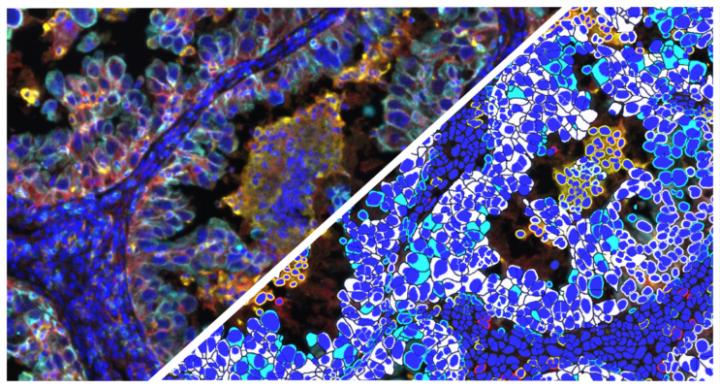
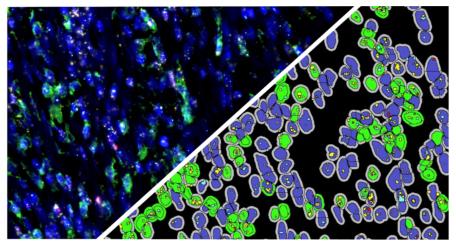
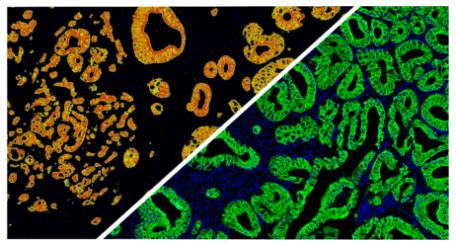
Use pre-trained deep-learning networks for optimized nuclear and membrane segmentation directly in the HALO platform with cell analysis modules in brightfield or fluorescence, including the Multiplex IHC and Highplex FL modules.
Want to train your own AI? Learn more about HALO AI.
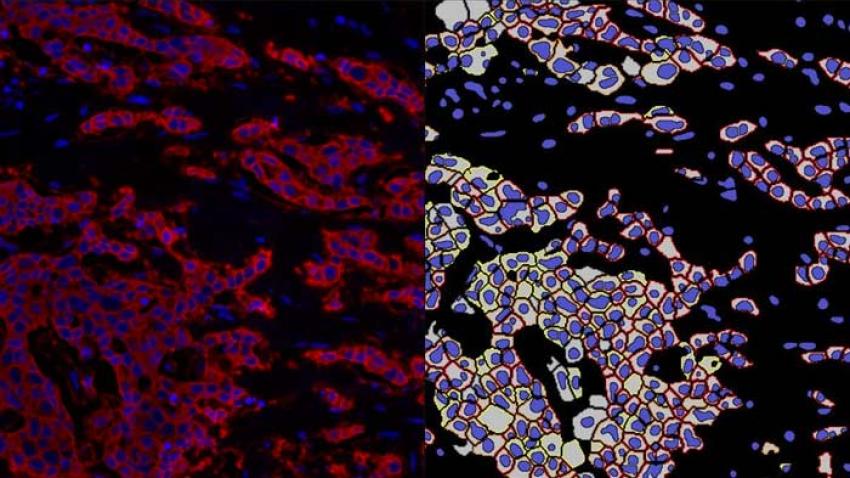
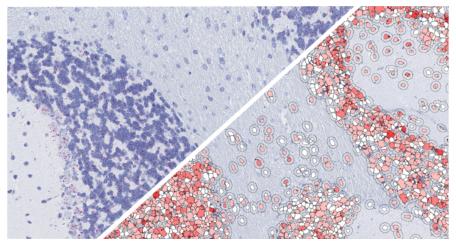
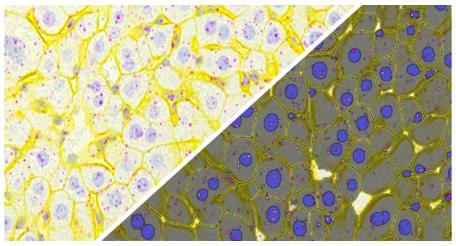
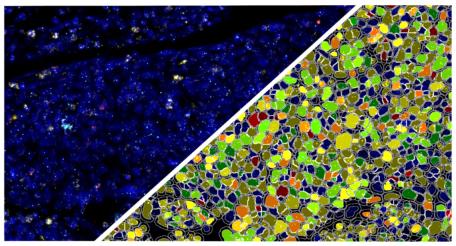
With pre-trained AI-based networks for nuclear and membrane segmentation available in both brightfield and fluorescence, optimizing your segmentation parameters has never been easier.
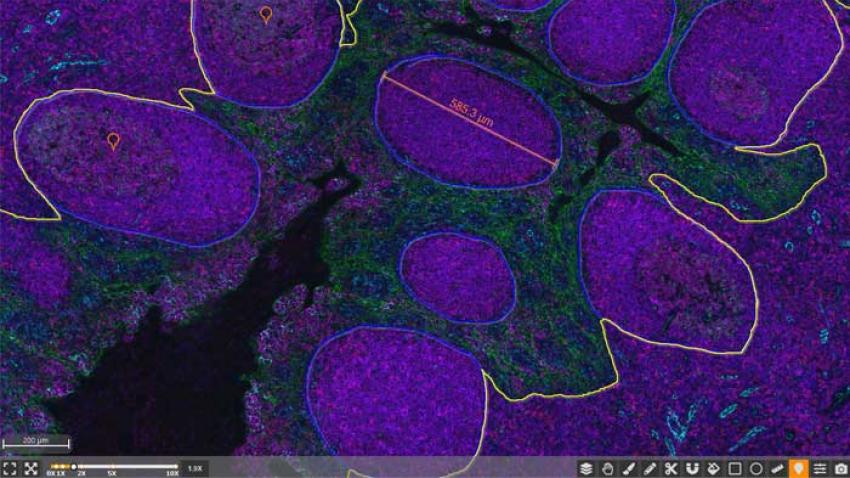
Annotate and explore images with a variety of freehand tools, reticle-based tools, toggle markup images, explore intensity data, measure distances, or take a quick snapshot.
Users can easily toggle Interactive markups on and off to investigate results within each cell population of interest.
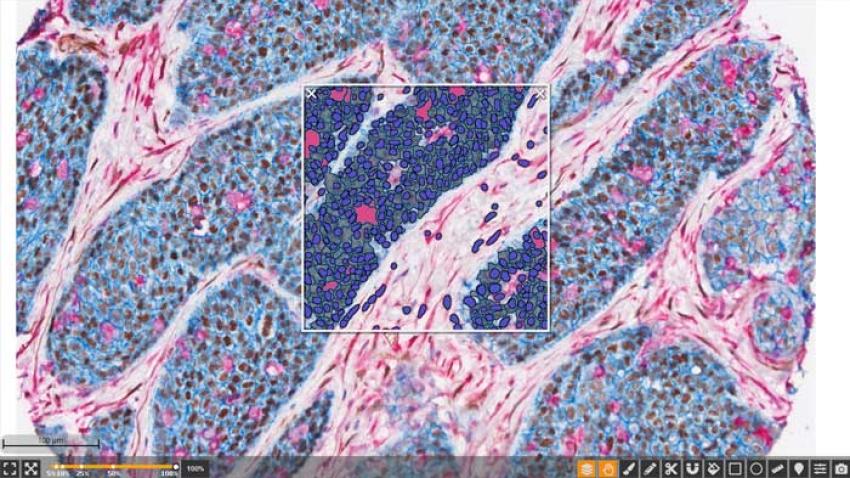
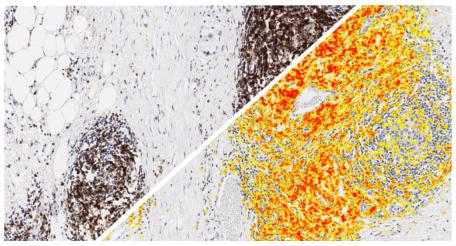
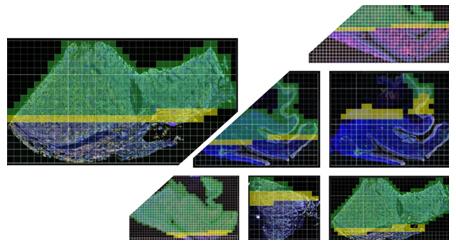
The powerful real-time tuning feature of HALO provides live feedback on image analysis parameters for ease of algorithm optimization. Built-in heatmap functionality provides spatial insights such as immune cell density surrounding a tumor, while image registration allows for serial IHC-stained slide viewing and synchronized navigation.
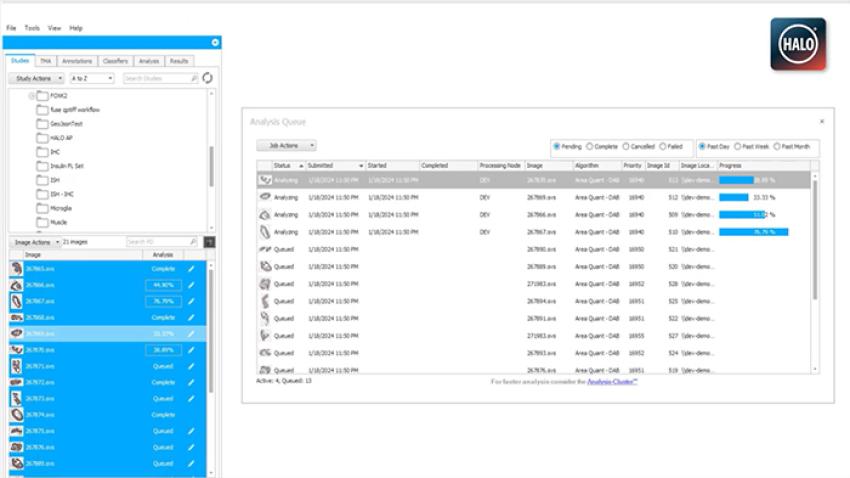
Customize image analysis outputs and set up calculations to deliver the data you need. Use saved analysis settings to queue batch analysis to run silently in the background while you continue to work in HALO.
Advanced data export features ensure you have the output you need, including exporting annotations, analysis or classifier settings, reports, summary data, object data in a spreadsheet or FCS format.
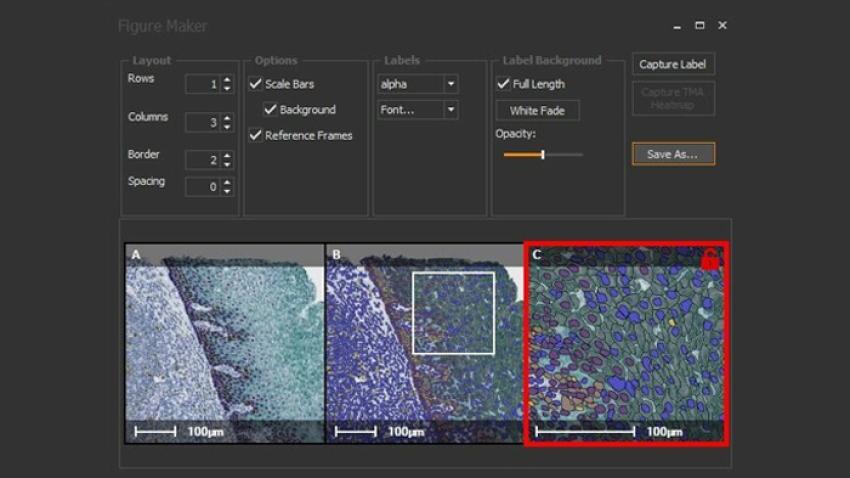
Acquire publication quality figures in just a few clicks with the figure maker feature. Quickly define the number of frames, select images of interest, then optimize scale bars, labels, fonts, opacity, and more. Save at your desired image size and resolution as a .png, .tif, or .jpg.
Modules
Quantify expression of up to five brightfield stains in any cellular compartment - membrane, nucleus or cytoplasm.
Quantify expression of an unlimited number of biomarkers in any cellular compartment - membrane, nucleus or cytoplasm.
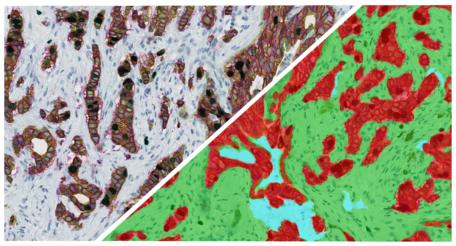
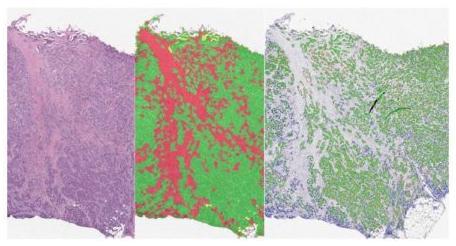
Separate multiple tissue classes across a tissue using a learn-by-example approach. Can be used in conjunction with all other modules (fluorescent and brightfield) to select specific tissue classes for further analysis.
Plot cells and objects from one or more images and perform nearest neighbor analysis, proximity analysis, and tumor infiltration analysis.
Simultaneously analyze up to three chromogenic and/or silver-labelled DNA or RNA ISH probes on a cell-by-cell basis, measuring spot numbers and area per cell and compartment, and calculated H-scores for each probe.
Simultaneously analyze a nuclear stain and up to four IHC biomarkers or ISH probes on a cell-by-cell basis across brightfield images.
Simultaneously analyze an unlimited number of fluorescent nucleic acid probes on a cell-by-cell basis, measuring spot numbers and area per cell and compartment, and calculated H-scores for each probe.
Use the HALO® FISH-IF module and reagents from Molecular Instruments or ACD, a Bio-techne brand, to simultaneously analyze an unlimited number of fluorescently-labeled DNA/RNA ISH probes and immunofluorescent protein biomarkers on a cell-by-cell basis.
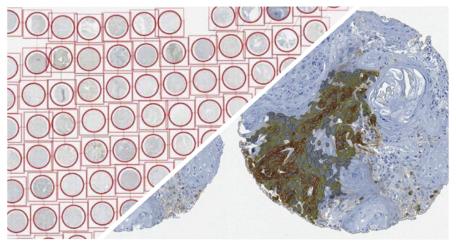
The TMA Add-on provides a productivity-enhancing workflow for tissue microarray analysis by enabling automated, high-throughput segmentation and batch analysis of whole slide TMA images.
Analyze serial tissue sections stained with different markers or a single tissue section which has been stained, stripped, and re-stained for multiple markers.
Deconvolve up to five colors in brightfield and measure positive area and average optical density for each stain and stain colocalization (where applicable).
Measure the positive area, average intensity and dye colocalization (where applicable) of an unlimited number of fluorescent dyes.
Simultaneously analyze up to five chromogenic stains and measure object density, area, diameter, and optical density, as well as colocalizations, if applicable.
Simultaneously analyze an unlimited number of fluorescent dyes and measure object density, area, diameter, and intensity, as well as colocalizations, if applicable.
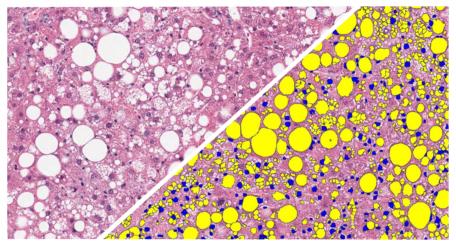
Quantify the area, diameter, perimeter, and number of white spaces per region of interest in brightfield images. Ideally suited for analysis of lipids in brown and white adipose tissue, lipid droplets in liver tissue (steatosis), and alveoli area in lung.
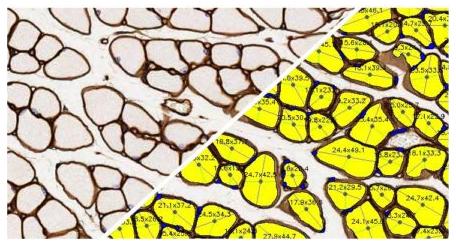
Quantify area, diameter, and perimeter of muscle fibers stained with laminin or other fiber membrane stains.
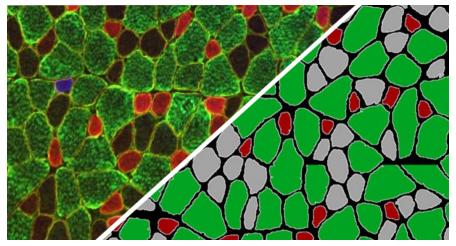
Quantify fiber or membrane positivity for an unlimited number of fluorescent dyes along with fiber diameter, perimeter, and area.
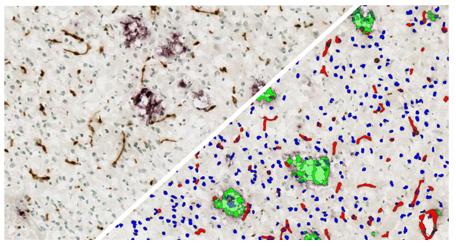
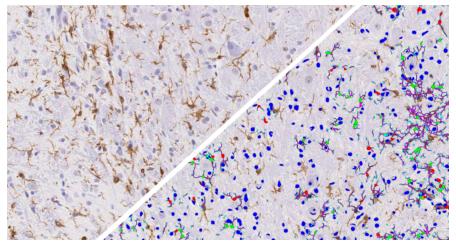
Quantify microglial activation based on length and thickness of microglial processes.
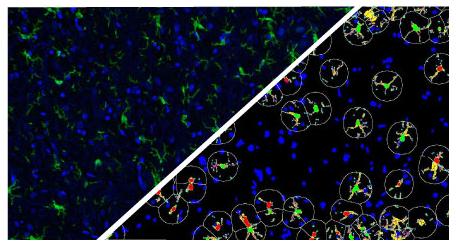
Quantify microglial activation in fluorescence based on detection of microglia, soma, and processes, by counting branch points, and by determining area, length, and thickness of processes.
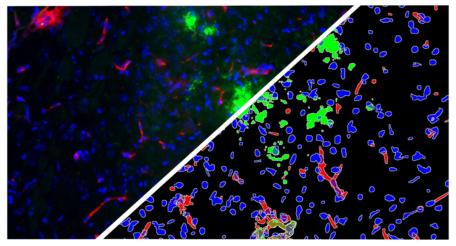
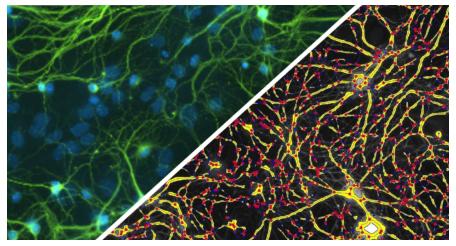
Quantify branch ends, area, length, and more for branched structures such as retinal vessels and cortical neurons in brightfield images.
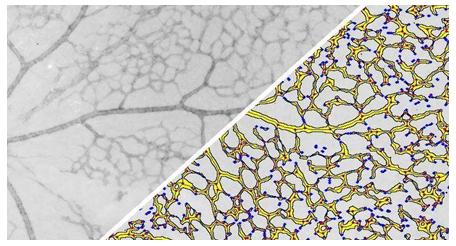
Quantify branch ends, area, length, and more for branched structures such as retinal vessels and cortical neurons in fluorescent images.
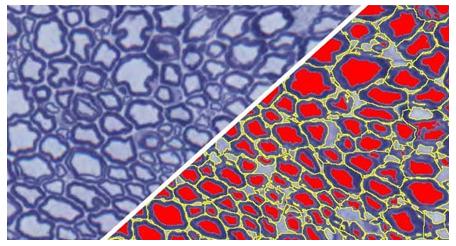
Quantify axons in nerve cross sections and calculate area, inner and outer diameter, myelin area, and G-ratio.
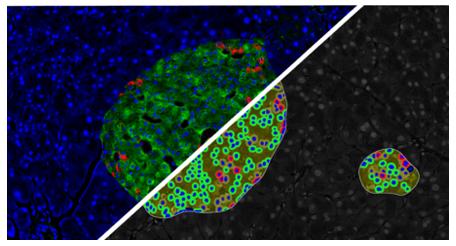
Count and measure pancreatic islets in brightfield images and quantify the islet area and cells positive for up to two islet-specific stains.
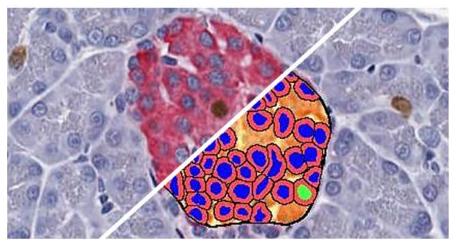
Count and measure pancreatic islets in fluorescent images and quantify the islet area and cells positive for up to three islet-specific dyes.
Process multiple images in parallel to maximize image analysis throughput and minimize analysis job turnaround times.
Increase your productivity with multi-core processing and batch analysis or with workflow tools for efficient tissue microarray and serial stain analysis.
The modular design of HALO allows you to choose the deployment option that works best for your team and local IT. Start with a few modules and add more as your needs change. Use HALO on a single workstation, on a server-based license or deploy enterprise wide.
HALO has a variety of data export and import tools so that you can work with your data outside of the HALO platform and then bring it back in.
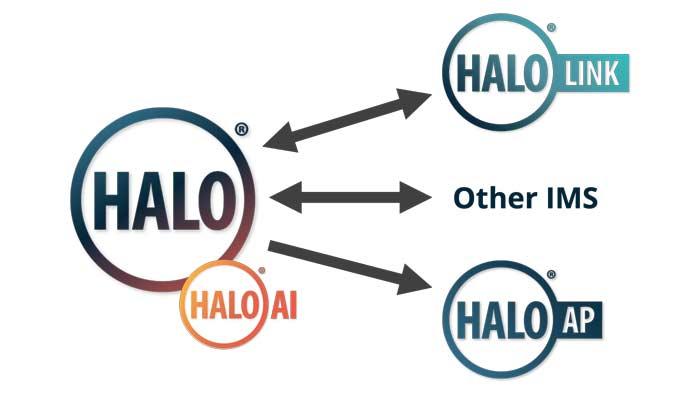
HALO also seamlessly integrates with our deep learning toolbox HALO AI, our study-based image management system, HALO Link, and our case-based image management system, HALO AP®.
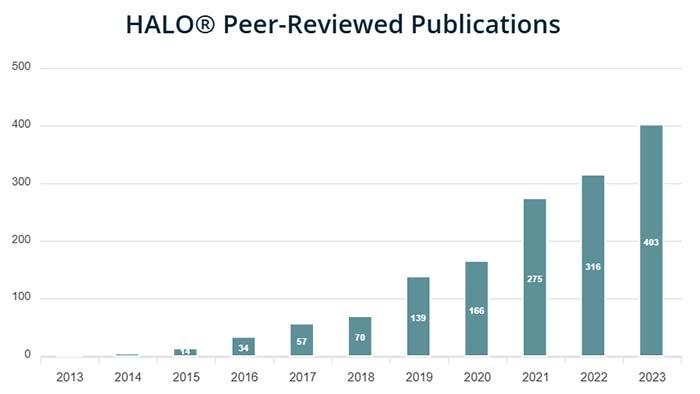
HALO users publish across a wide range of disciplines and research areas, with oncology and immuno-oncology leading the publication count, shortly followed by neuroscience, metabolism, immunology, and infectious disease. HALO image analysis appears in over 1,000 peer-reviewed publications and every year the number of publications continues to grow!