Knowledge Pathway
The Pathology Learning Hub
Explore Our Educational Resources Today!
Knowledge Pathway is a curated library of educational content for pathology professionals. Discover practical resources for each step in the pathology workflow, such as tutorials, webinars, and case studies.

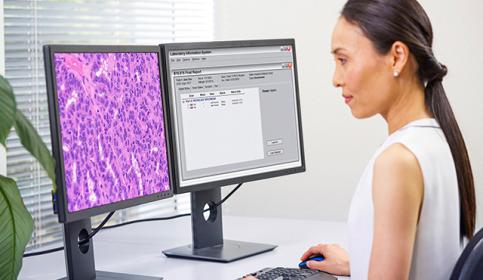
Digital Pathology and AI
Adopting digital pathology enables pathologists to manage and interpret information generated from a digitized glass slide. Coupled with AI tools, pathologists can benefit from efficiencies in their workflow. Learn how to start transforming your lab with guidance from experts in the field.