
 -
-
 Logout



Mindpeak PanTumor PD-L1
Mindpeak PanTumor PD-L1 is an AI-powered application for automated PD-L1 immunohistochemistry quantification across multiple solid tumor types in research workflows. A single pan-tumor model detects and classifies tumor cells and PD-L1-positive mononuclear immune cells across the entire whole slide image, returning both the Tumor Proportion Score (TPS) and the Combined Positive Score (CPS)—no region drawing and no manual counting. Subregions can also be annotated to recompute either score locally.
For Research Use Only. Not for use in diagnostic procedures.



 Zoom image
 Tumor and Immune Cells, One Pass
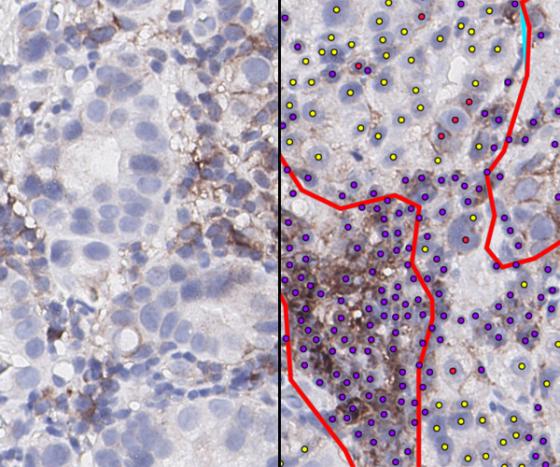
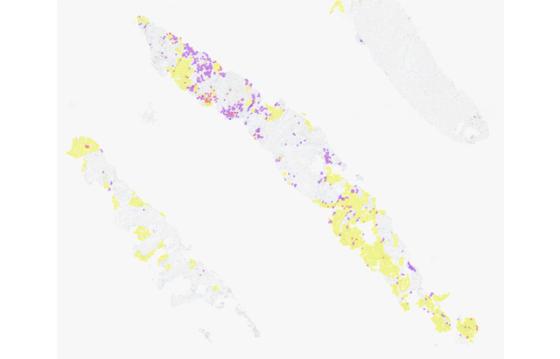
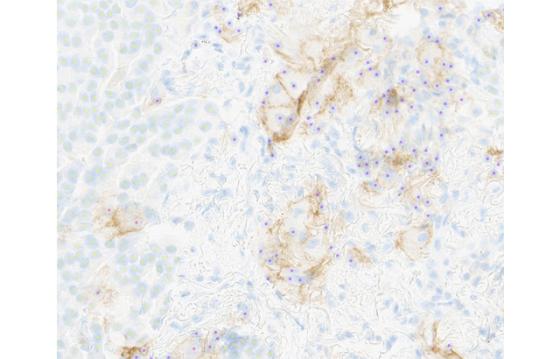
0-click whole slide analysis of tumor and immune cells. When a compatible PD-L1 whole slide image is opened, analysis runs automatically across the entire whole slide image—no region drawing, no manual counting. A single pan-tumor model detects tumor cells and PD-L1-positive mononuclear immune cells, classifies each one, and returns a color-coded overlay within seconds. A PD-L1 read depends heavily on where the researcher chooses to score, and complete coverage takes that choice out of the output: the scores reflect the whole slide rather than a selected field. Every classified cell is displayed, so a score can be traced back to the cells behind it, and the overlay doubles as the audit trail for the analysis. The tumor-cell population and the immune-cell population are detected in a single pass, so producing a CPS does not require a second analysis or a second application, and the two readouts always describe the same slide.
Regions, Controls, and Necrosis Handled
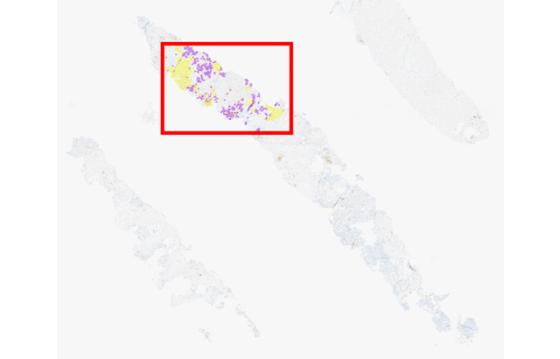
Region-level interrogation, with control tissue and necrosis handled. The 0-click analysis covers the whole slide, but the output is not locked to it. Annotated subregions recompute the Tumor Proportion Score (TPS) and the Combined Positive Score (CPS) within the drawn area, with cell counts provided. This allows a specific area to be examined independently or enables unrepresentative tissue to be excluded, such as a second block, a poorly fixed fragment, or a crush artifact. Control tissue and necrosis are excluded automatically, so they do not distort the output before anyone intervenes. Regional findings are presented alongside the whole slide assessment rather than replacing it, ensuring both views remain available when the analysis is complete. Each drawn region carries its own counts next to its scores, so the basis for a regional figure is as visible as it is for the whole slide.
One Model, TPS, and CPS
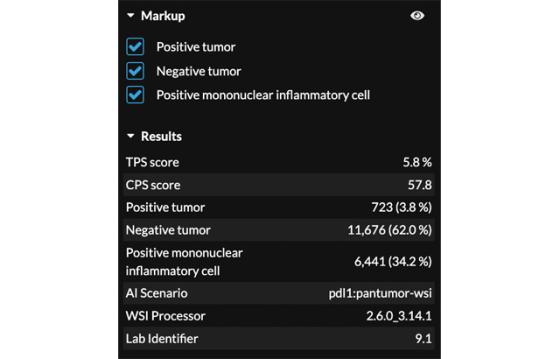
One model, both scores, across tumor types. A single pan-tumor model returns the Tumor Proportion Score (TPS) and the Combined Positive Score (CPS), with tumor-cell and immune-cell readouts. TPS is available for non-small cell lung carcinoma, and CPS is available for gastric and gastro-oesophageal junction, head and neck, cervical, oesophageal, triple-negative breast, and urothelial carcinomas. Common PD-L1 assays are supported for research use, including antibody clones 22C3, 28-8, SP263, and SP142. For laboratories running PD-L1 across several tumor types, this means one application and one configuration to learn rather than a separate tool for each tumor type. TPS expresses the proportion of PD-L1-positive tumor cells. CPS additionally incorporates PD-L1-positive immune cells relative to the tumor cell population. Both scores are reported together rather than as separate analyses.
Built for the Hardest IHC Read
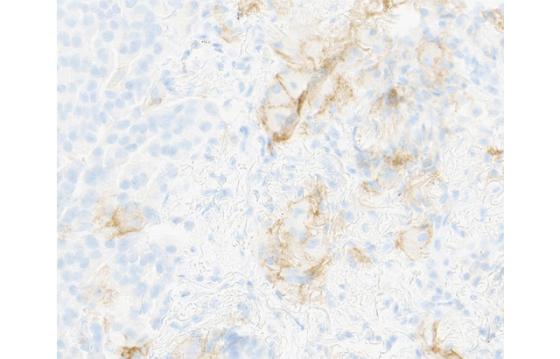
PD-L1 assessment is a challenging task: the researcher must recognize membranous staining on tumor cells and, for CPS, identify PD-L1-positive immune cells across the whole slide. Mindpeak PanTumor PD-L1 replaces the visual estimate with an exhaustive per-cell count: every tumor cell is classified as positive or negative, and every PD-L1-positive mononuclear inflammatory cell is counted, so the score is calculated rather than judged by eye. Because the same criterion is applied to every cell on every slide, borderline findings are resolved on a consistent basis. The researcher reviews the output and can accept or reject it.
Both Scores, and the Counts Behind Them
A transparent score, traceable to the cells that produced it. Outputs are returned as TPS and CPS together with the per-class cell counts that produced them: tumor-positive, tumor-negative, and positive mononuclear inflammatory cells, plus total tumor cells, total cells, detected area, and cell densities. Individual markup classes can be shown or hidden during review, letting a researcher inspect one population at a time before accepting the output. The panel also records the provenance of each analysis: the AI scenario applied, the processor version, and the laboratory identifier. Because the counts and the scores derived from them are displayed side by side in the same panel, a researcher can see how each figure was derived simultaneously. The application supports whole slide images from a range of scanners.
A PD-L1-stained tumor whole slide is opened, and analysis starts automatically, with no region drawn and no cells counted by hand. Within seconds, tumor cells and PD-L1-positive mononuclear immune cells are classified and rendered as color-coded markers over the tissue, and the Tumor Proportion Score and Combined Positive Score appear alongside the counts that produced them. The video then shows an annotation drawn over part of the slide to recompute both scores within that area, demonstrating how unrepresentative tissue can be set aside. Markup layers are shown and hidden so each population can be inspected separately. At no point does the researcher draw a region before analysis begins.
Specifications
| Tissue type | Multiple solid tumor types, including non-small cell lung, gastric and gastro-oesophageal junction, head and neck, cervical, oesophageal, triple-negative breast and urothelial carcinoma; formalin-fixed, paraffin-embedded |
| Biomarker / assay: | PD-L1 immunohistochemistry (IHC) |
| Supported antibody clones: | 22C3; 28-8; SP263; SP142 |
| Required image resolution | 0.5 µm/pixel plus/minus 10% (20x equivalent) |
| Outputs | Tumor Proportion Score (TPS) and Combined Positive Score (CPS); per-class cell counts (tumor positive, tumor negative, positive mononuclear inflammatory cells); total tumor cells and total cells; detected area and cell densities; cell-level marker overlay with per-class markup layers |
| Analysis mode | 0-click whole slide analysis with optional annotation subregions drawn |