
 -
-
 Logout



Mindpeak Breast ER
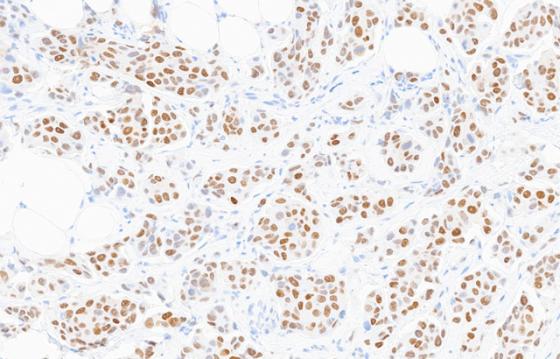
Mindpeak Breast ER is an AI-powered application for automated estrogen receptor immunohistochemistry analysis of invasive breast carcinoma whole slide images in research workflows. The algorithm locates invasive tumor and classifies every tumor cell nucleus as ER-positive or ER-negative across the entire slide, outputting a positivity slide—no region drawing and no manual counting. Subregions can then be annotated to exclude tissue or compare expression between areas.
For Research Use Only. Not for use in diagnostic procedures.



 Zoom image
 0-Click Whole-Slide Analysis
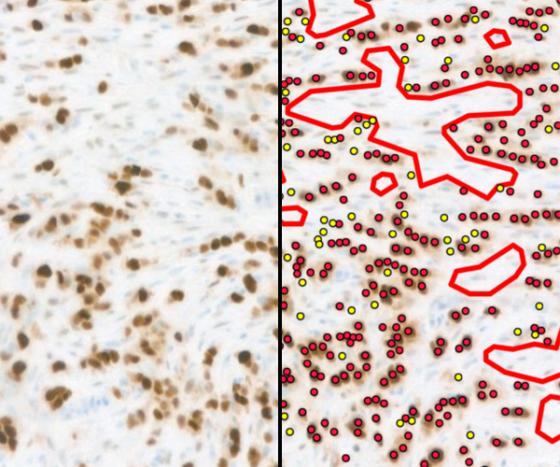
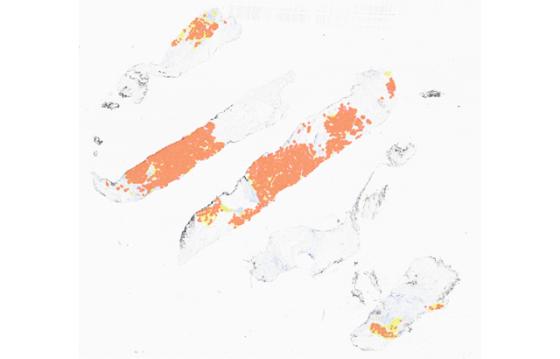
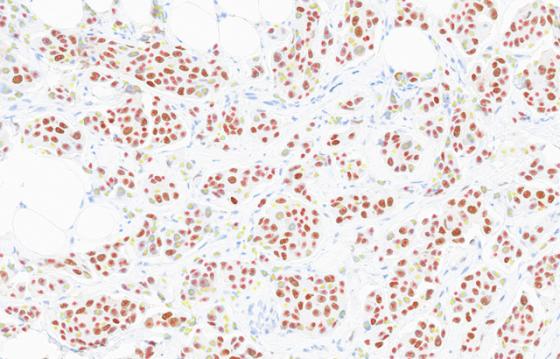
When a compatible ER image is opened, analysis runs automatically across the entire slide—no region drawing, no manual counting. The algorithm locates invasive tumor, classifies every tumor cell nucleus as ER-positive or ER-negative, and returns a color-coded overlay within seconds. Because coverage is complete rather than a hand-picked field, the output does not depend on where a researcher happens to look, which is one of the best-documented sources of variability in hormone scoring reporting. At low magnification, the overlay shows immediately how ER expression is distributed across the slide and how much scoreable tumor it contains. Because the score is derived from the same cells displayed in the overlay, the overlay also provides a clear audit trail. Every tissue fragment on the slide is included in the analysis, including the small or fragmented cores that are easiest to overlook on a manual read.
Score Any Subregion You Draw
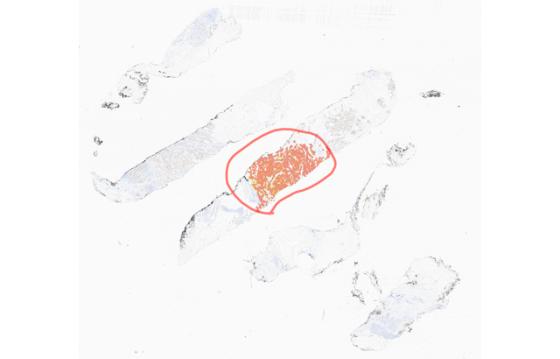
Region-level interrogation of the whole slide analysis. The 0-click analysis covers the whole slide, but the output is not locked to it. Using the standard annotation tools in Aperio HALO AP software, subregions can be drawn on top of the completed analysis and scored individually, each returning its own positivity score and its own positive and negative cell counts. This supports two capabilities that whole slide scoring alone cannot provide. Tissue can be excluded from consideration, such as a second core, a poorly fixed fragment, crush artifact, or an area the researcher judges unrepresentative. And ER expression can also be compared between regions, making intratumoral heterogeneity measurable rather than impressionistic: per core, per tumor focus, or across any regions of interest the study design calls for. Regional results are presented alongside the whole slide result rather than replacing it, ensuring both views remain available when the case is reported.
Where the Cutoffs Are Hardest
ER reporting turns on two narrow cutoffs. The algorithm returns an ER-positive score when 1% or more of tumor cell nuclei are stained, and images falling between 1% and 10% are returned as ER-low positive. Positive and Low-Positive categories require a researcher to estimate a percentage from a heterogeneously stained slide, and both occur precisely where manual estimation is least reproducible. Mindpeak Breast ER replaces the estimate with an actual count: every tumor cell nucleus on the slide is classified and totaled, so the percentage is computed rather than judged by eye. Because the count is exhaustive rather than sampled, the output is standardized and independent of which researcher reviews the images, the difficulty of the staining interpretation, and how long they spend on it.
Every Nucleus Counted, Not Estimated
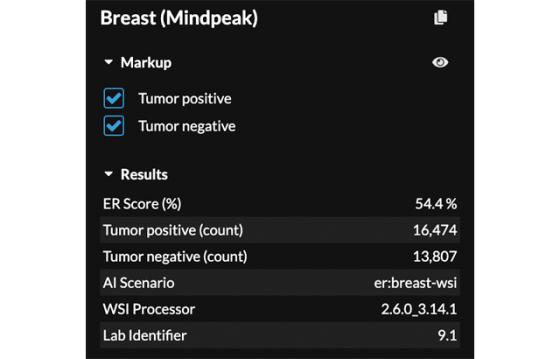
Each tumor cell nucleus on the slide is delineated and classified according to its ER staining, and the positivity score is returned as the proportion of positive nuclei within the total tumor nucleus population, providing a measured count rather than a visual estimate. The full classification is rendered over the tissue, allowing researchers to see exactly which nuclei produced the percentage score and to assess complex samples based on visible evidence. Because the count is exhaustive rather than sampled, the same slide is assessed on the same basis every time, independently of the researcher.
A Score You Can Check
A score with the numbers behind it, on your scanner. Findings are returned directly to the Aperio HALO AP software as a positivity score together with the positive and negative tumor cell counts used to generate it, providing visibility into the basis of the analysis, so the reasoning is visible rather than implied. Individual markup classes can be displayed or hidden while reviewing, allowing the researcher to inspect positive or negative cell populations independently before accepting the result. The application was evaluated across four whole slide scanners including the Leica Biosystems Aperio GT 450 scanner, two ER staining systems, and the SP1 and EP1 antibody clones, with result shown to be consistent across scanner, staining system, reagent, and operator. Deployment requires no specialized on-site hardware beyond a compatible scanner and a standard workstation, enabling laboratories to adopt the application without changes to their existing imaging infrastructure.
An ER-stained invasive breast carcinoma whole slide image is opened, and analysis starts automatically, with no region drawn and no cells counted by hand. Within seconds, every tumor cell nucleus is classified as ER-positive or ER-negative and rendered as a color-coded marker over the tissue, and the positivity score appears alongside the counts that produced it. The video then shows an annotation drawn over part of the slide to score that region on its own, demonstrating how tissue can be set aside or regional expression compared without repeating the read. Markup layers are shown and hidden so the positive and negative populations can be inspected separately.
Specifications
| Tissue type | Primary invasive breast carcinoma (invasive ductal carcinoma, invasive lobular carcinoma); formalin-fixed, paraffin-embedded |
| Biomarker / assay: | Estrogen receptor (ER) immunohistochemistry (IHC) |
| Supported antibody clones: | Clone SP1 ; Clone EP1 |
| Required image resolution | 0.5 µm/pixel plus/minus 10% (20x equivalent) |
| Outputs | ER positivity score (percentage of positive tumor nuclei); positive and negative tumor cell counts; cell-level marker overlay |
| Analysis mode and deployment | 0-click whole slide analysis with optional annotation subregions; cloud or on-premise deployment supported |