
Study on the Performance of Different Cover Glasses in Microscopy
Study on the performance of different cover glasses in microscopy, conducted by a renowned institute in Jena, Germany. Commissioned by Leica Biosystems GmbH, Nussloch, Germany; September 2025.
- Introduction
-
Measurement of optical properties of the covering media
2.1. Surface profile measurements
2.2. R/T-measurements
2.3. Ellipsometric measurements -
3.1. Optical Model of Leica Scanner Optics
3.2. Modelling of coverslip inhomogeneities in Zemax
3.3. Results of modeling - Measurement of surface scratches and contamination
- Summary
1. Introduction
The content of this project is a comparative study of the influence of different cover media on the image formation in microscopic applications. Specifically, it involves a comparison between conventional cover glasses (Leica HistoCore SPECTRA CV) and polymer films (Sakura Tissue-Tek). The provided samples were automatically prepared on a Leica and a Sakura Tissue-Tek coverslipper.
Cover glass and mounting media practically form the front optics of each biomedical microscope. As all current microscope objectives show diffraction-limited resolution, only slight deviations in the optical properties of these components will influence the performance of the microscope optics. That’s why the optical design of these lenses must consider the optical properties of the cover media.
The most important parameters to consider are refractive index, absolute thickness and surface flatness. These are mainly responsible for degradations in the quality of the microscopic image. In addition, induced shape deviations of the cover slip, which occur when the cover film adapts to the underlying sample can cause optical aberrations in the light path.
This report provides a summary of the key findings from the measurements and simulations.
2. Measurement of optical properties of the covering media
2.1 Surface profile measurements
Two different methods were applied to characterize the surface topography and roughness of the cover media: tactile profilometry and white light interferometry:
- Tactile profilometry: this method was performed with the Form Taly Surf PGI Plus from Taylor Hobson. The machine measures all kinds of surface 3D-geometry, such as radius, slope, roughness and waviness. A 60-degree stylus with a tip radius of 2 μm was used for all measurements providing a vertical resolution in the nm-range.
-
Scanning white light interferometry: this contactless measuring method as taken with the ZYGO NewView 7300 optical surface profiler which can measure profile heights ranging from less than 1 nm up to several mm. The Michelson setup was used for overview measurements with a 5x/0.25 objective lens whereas Mirau lenses of 20x/0.4 and 50x/0.55 magnification were used for small image fields.
Micro roughness:
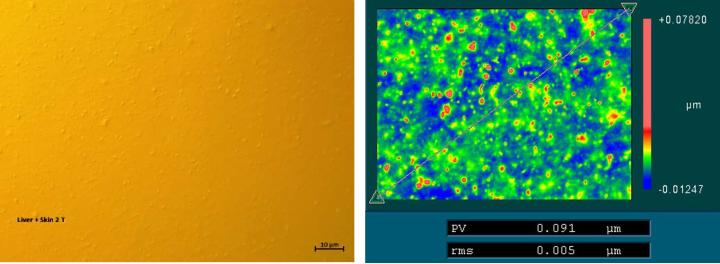
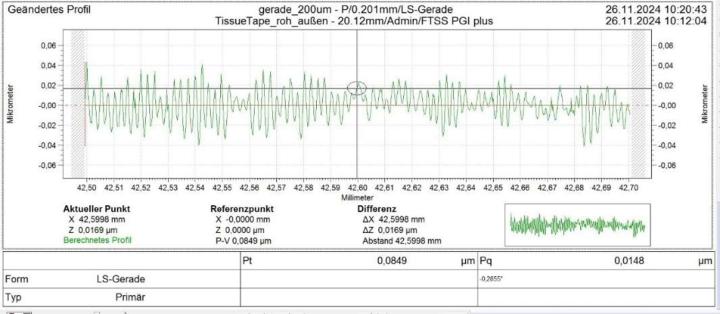
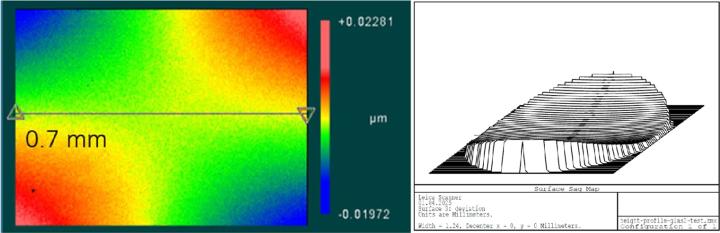
The surface of the Sakura tape exhibited typical micro roughness with nubbly structures whereas the cover glass surface was very smooth (below detection noise). This microstructure was observed on the raw tape material as well as on the blank and tissue samples covered with Sakura tape. Typical values of 5-6 nm rms roughness could be measured using white light interferometry (Figure 1). Values determined by the tactile profilometer were slightly higher but proved the rough surface of the polymer film (Figure 2). One possible cause could be the significantly higher background noise of the profilometer in its measuring environment compared to the interferometer setup.
(Sample size: 7 tape samples, including 2 blank samples, 4 with tissue sections, and 1 raw material sample (tape))
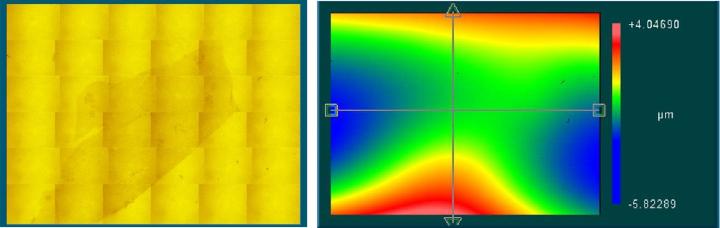
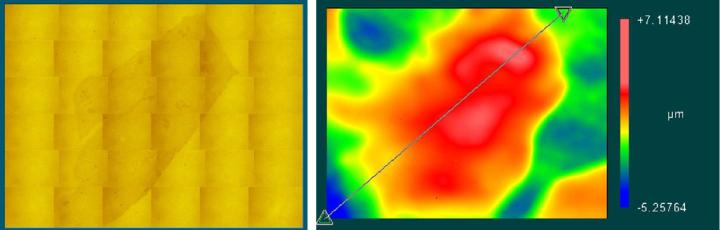
Waviness:
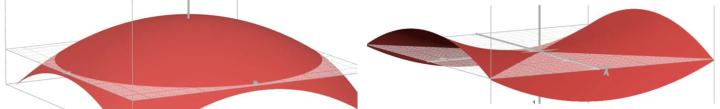
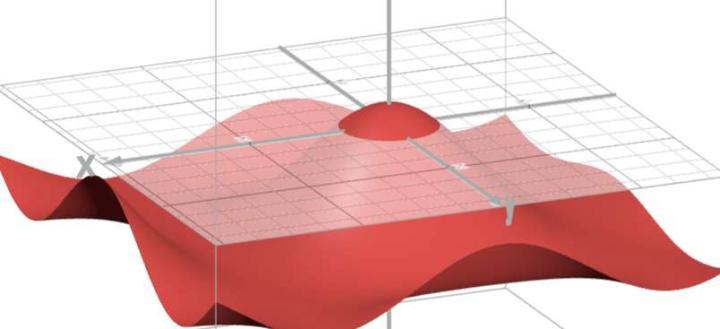
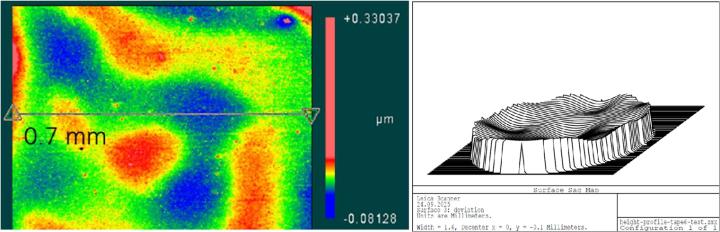
When mounted to the object slides, both types of cover media showed surface corrugations with comparable pv- and rms-values. However, whereas glass coverslips showed gentle bending with relatively large periods (Figure 3) the tape surface was dominated by characteristic irregular ripplings with smaller periods (Figure 4).
The values for the biological samples generally were 2-3 times higher than those for the blank samples. This was observed for both types of cover media.
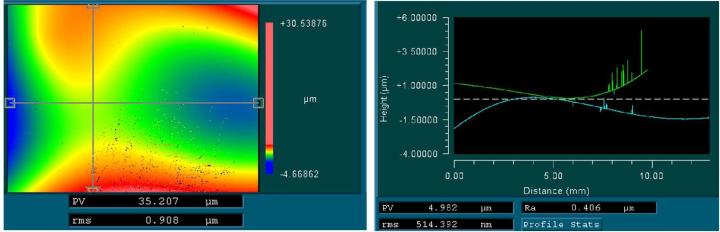
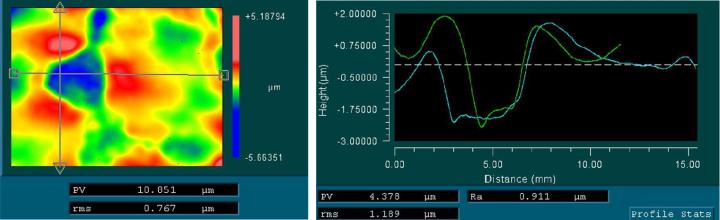
For the tape samples, the structure of the underlying tissue sections was roughly replicated in the surface profile. For the glass samples, the bending of the cover glass was almost completely unrelated to the shape of the tissue (compare Figure 5 and Figure 6).
More details are documented in the corresponding slides (Report_Praep_und_Leerproben-SK- 2025-06-26.pdf).
2.2 R/T-measurements
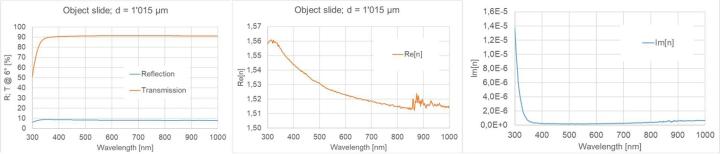
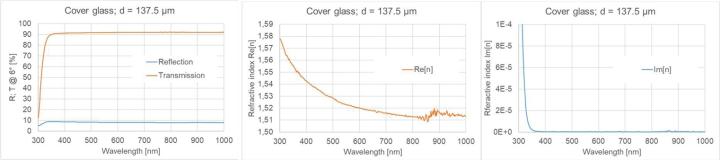
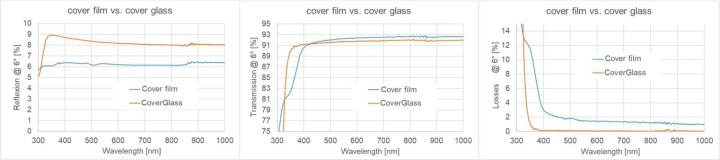
Measurements of wavelength-resolved reflection and transmission in the wavelength range from 300 nm to 1000 nm at an angle of incidence of 6° were performed for object slides, cover glasses as well as Sakura cover tapes (see Figure 7, Figure 8, Figure 9). For this purpose, a commercial photo-spectrometer from PerkinElmer was used with an additional internal measuring add-on, which ensures that the reflection and transmission data are determined at exactly the same location on the sample. For wavelengths greater than approximately 850 nm, a detector change is required in the device, which actually necessitates a modified measurement regime (see e.g. center of Figure 7). We did not do this in the study, as only the VIS range is of interest. If the thickness of a homogeneous sample is known (in practice, the thickness can be determined relatively easily and accurately by tactile measurements), the real and imaginary parts of the refractive index can be calculated at each wavelength point from the two measured variables, i.e. transmission and reflection. Since light losses are not separated into individual loss channels in these measurements, the imaginary part contains both absorption and scattering contributions.
Figure 7 and Figure 8 show R-T spectra and refractive index dispersions of the object slide and the cover glass. It can be seen that the two samples are well index-matched. The losses are small and only increase significantly below 350 nm.
In the case of the cover film, it was difficult to determine the dispersion from the spectral data (for more information, see the chapter on ellipsometry). For this reason, only a comparison of the spectral data from the cover film/ Sakura film and cover glass is shown here (see Figure 9). The transmission and reflection data of cover glass and Sakura cover film are noticeably different, especially for short wavelengths below 400nm. In the wavelength range from 400 to 1000 nm, the Sakura tape shows lower reflection and higher transmission values than the cover glass, which indicates a noticeably reduced refractive index. The losses (100%-R-T) in the film are significantly higher than in the cover glass. The tape losses gradually increase from the minimum value (slightly greater than 1%) at large wavelengths towards smaller wavelengths. This is probably due to greater scattering losses on the upper side of the film (compare Figure 1). Below 400 nm, there is a sharp increase in losses from 3% at 400nm to 13% at 325 nm (probably absorption-dominated).
2.3. Ellipsometric measurements
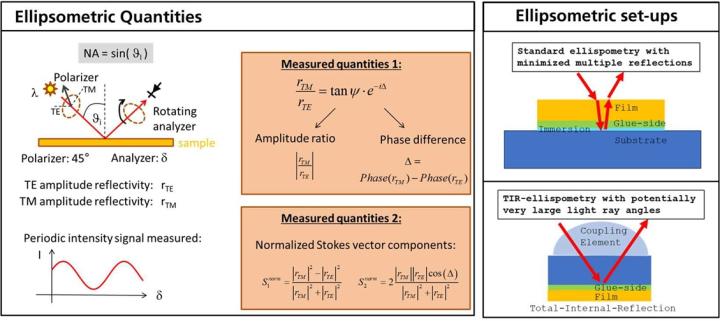
In ellipsometry, a sample is irradiated with polarized light at different angles of incidence (𝜃i or numerical apertures sin(𝜃i ) = 𝑁𝐴i ) and different wavelengths (λ). The reflected light (or transmitted light – although we will limit ourselves here to reflection measurements) is evaluated using a rotating polarization analyser. The measured variable is often given as the quotient of TM and TE reflectivity (TE: transverse electric, TM: transverse magnetic) in the form of the ellipsometric angles 𝜓 and Δ (see Figure 10, left). 𝜓 describes the ratio of the amount of the reflectivities, while Δ represents the phase difference between the TE and TM reflection. Both quantities can be converted unambiguously into the normalized Stokes parameters S1 and S2. Ellipsometry can be used advantageously in the characterization of dispersion properties, especially in the presence of birefringence. Within the scope of the project, we use two different types of ellipsometry (see Figure 10, right), namely standard ellipsometry with back reflection reduction (Figure 10, top right) and TIR (total internal reflection) ellipsometry (Figure 10, bottom right). The latter method allows very sensitive statements to be made about the birefringence of materials due to the very large light propagation angles as well as due to the double pass of the light through the medium.
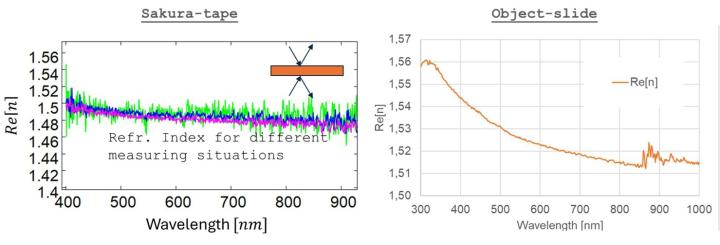
As explained in the previous chapter, there were problems with the dispersion characterization of the cover films using RT spectroscopy. RT measurements at an angle of incidence of 6° must consider the multiple reflections on the front and back of the sample. However, the back reflections on Sakura film were disturbed by the film corrugations, so that modelling over a quasi-infinite series of multiple reflections no longer works properly. The dispersion data obtained from RT measurements was too inaccurate. These problems can be circumvented with standard ellipsometry with back reflection minimization. Characterizations were performed for different measurement configurations: different angles of incidence, different sample orientations, measurements on the top or bottom of the sample. Some example graphs are shown in Figure 11 (see differently coloured graphs). This investigations showed that the refractive indices change only slightly:
- depending on the angle of incidence (longitudinal birefringence),
- depending on the sample orientation (transverse birefringence)
- for incidence on the top side compared to the bottom side of the cover film.
From this, it can be concluded that the Sakura tape could exhibit only a small birefringence. The indices on the top side of the film and the glue-side of the film match within the scope of this measurements approach. However, it appears that the cover film has a noticeably lower refractive index (>~0.03) than the object slide (compare the left and right graphs in Figure 11), i.e., the Sakura cover film is not as ideally index-matched to the object slide as the cover glass.
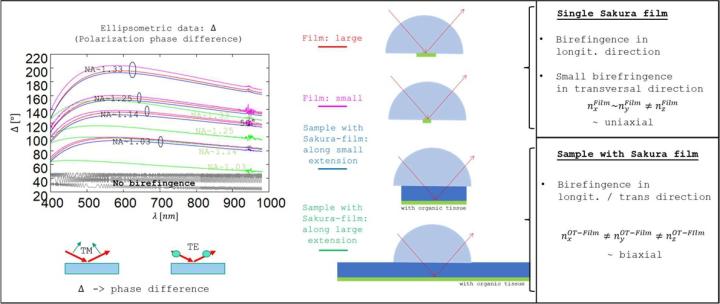
In order to quantitatively measure the birefringence of the cover film, a more sensitive method than ellipsometry at a single interface is required. TIR ellipsometry (see Fig. 10, left) was used for this purpose.
As expected, the measurements showed that microscope slides, cover glasses and samples with cover glass do not exhibit birefringence (see details in corresponding slides Ellipsometry_DM- 2025-06-26.pdf). In contrast, birefringence was detected and quantified for single cover films as well as samples with Sakura tape. Figure 12 shows the corresponding measurements of the polarization phase difference 𝚫 by TIR ellipsometry for different sample orientations and different angles of incidence/numerical apertures NA.
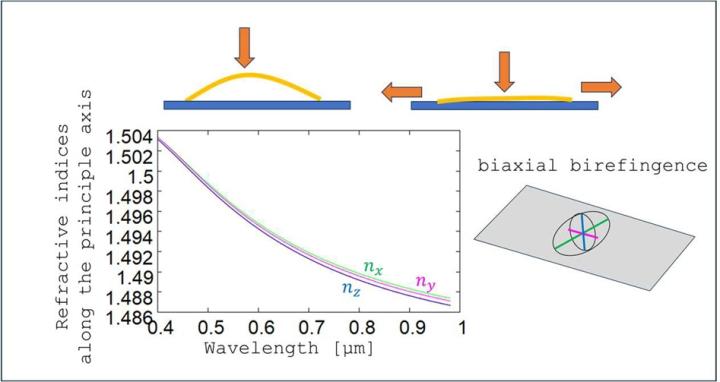
For comparison, ideal simulations for an isotropic (non-birefringent) layer with the same layer thickness and similar isotropic dispersion data is shown in Figure 12 (see grey curves). All measurements with Sakura tape show significant deviations from these isotropic simulations, i.e. birefringence is present in all measurement situations. The investigations of single cover films indicate that the phase differences Δ are approximately the same for different sample orientations. In Figure 12, only two mutually perpendicular orientations are shown. The red curves are measurements along the long extension of the cover film and the magenta curves are the phases along the short side. The phase differences Δ change for different angles of incidence or numerical apertures. Thus, the single film has uniaxial birefringence, with the optical axis parallel to the layer normal. The two identical principal axis indices lie in the layer plane, while the third principal axis with a modified index is perpendicular to the layer. For numerical apertures in the order of NA~1, TE-TM phase differences of approximately pi/2 are present, which corresponds to a potentially significant change in the polarisation state. With larger NA, this phase difference increases further.
The birefringent behaviour changes when the Sakura film is applied to a microscope slide. Although the phase differences remain the same as for single layers when measurements are taken along the short side of the sample (see blue curves in Figure 12), the Δ - values gradually decrease as the sample is rotated. Minimal phase differences are present along the long side of the sample (see green curves in Figure 12). The film now becomes optically biaxial. This behaviour was observed for both blank samples and samples with objects, although the quantitative values of birefringence may vary from sample to sample (see pdf slides).
The main axis indices nx, ny, nz of the Sakura film can be calculated from the ellipsometer measurements. Figure 13 shows that the differences in the main axis indices (Δ𝑛 < 5 × 10⁻⁴ ) are quite small. The large phase differences Δ for such small refractive index differences can be explained by the large film thickness of approx. 150μm, i.e. even with low birefringence, the light accumulates large phase differences during propagation through the tape.
Finally, it should be noted that in the measurements in Figure 12, the amplitudes of the high frequency ripple are many times smaller than in the simulations. The reason for this seems to be the surface corrugations of the film material which prevent such interference effects in the tape.
In summary, we can conclude that for standard microscope examinations (moderate NA-values, brightfield illumination) no influence of birefringence on the image quality is to be expected. The reason for this this is the only slight differences in the main indices of the index ellipsoid. However, for high NA applications (NA > 1), and in particular for polarisation microscopy, effects will become visible due to the large TE-TM phase differences.
3. Optical Simulations
3.1. Optical Model of Leica Scanner Optics
The following optical specifications of the Leica slide scanner were obtained from the project partner:
- custom-made Plan-APO objective lens, f = 10 mm, NA 0.65
- custom-made tube lens, f = 400 mm
- distance exit pupil – tube lens: ~ 140 mm
- microscope magnification 40x
- object field Ø 1.25 mm (1.08 mm used)
- camera field Ø 43 mm
- imaging method: brightfield only
- sample tissue thickness: ~ 4 μm
Based on these parameters a simplified optical model was created using ZEMAX optical design software.
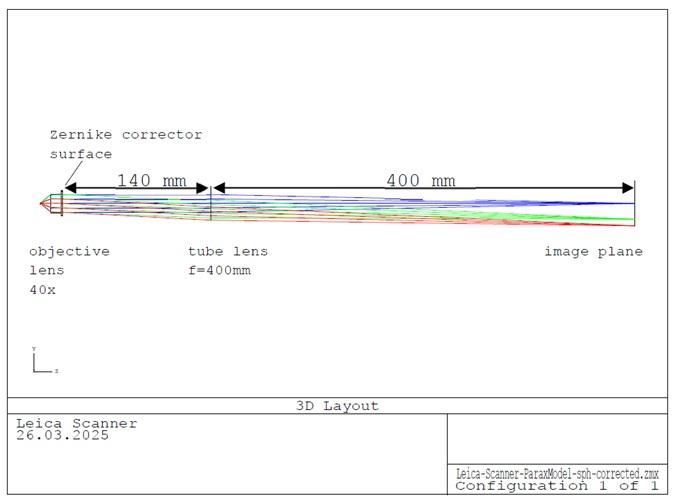
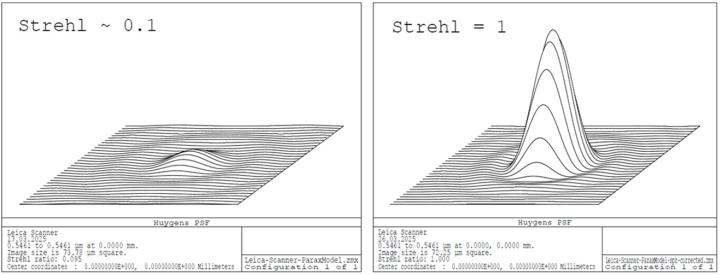
An additional Zernike surface in the exit pupil of the objective lens had to be introduced to compensate for the spherical error caused by the cover slip (0.44 λ primary spherical aberration). In real-world design this error is compensated by the optical design of the objective which must be adapted for the cover glass.
As the real design data could not be provided by Leica, ideal lenses are used (Zemax paraxial lens model). Because of the highly corrected optics involved in microscopy systems this is largely justified. However, there are some minor limitations of that model:
- Zemax ideal lenses do not satisfy Abbe’s sine condition (numerical aperture and exit pupil diameter do not match exactly!)
- polarization effects cannot be fully modeled (glass / coating data were not made available by the customer)
- aberrations of the real system are unknown, so it is difficult to assess the absolute value of lens performance under the influence of the cover media
3.2. Modelling of coverslip inhomogeneities in Zemax
The measured deviations of the cover glass and tape samples from an ideal plane-parallel plate were modeled by one of the following mathematical functions:
a) Zemax “biconic surface”:
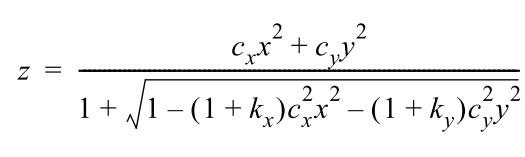
Biconic surfaces are suitable for modeling bulges or saddle surface which are typical for cover glass deformations:
b) Zemax “periodic surface”:
This surface type can be used to model the corrugations that are usually measured on coverslip film.
Glass and tape samples were modeled with the data obtained from the surface profile measurements. Analyses were performed for both blank samples (without biological sections) and real samples (with tissue sections).
Pv-values (peak-to-valley) of surface irregularities for glass and tape samples are in similar ranges (0.1 … 10 μm). However, compared to the cover glass samples the periods of the tape deformations were typically much smaller and the shape of the deformations were more irregular (compare Figure 18 and Figure 19). The values for the biological samples were approximately 2 to 3 times higher than those for the blank samples, both for the glass and the tape.
The following optical performance criteria were mainly used to assess the impact of the disturbances on the image quality:
- Strehl ratio as an integral metric of optical performance. It is defined as the ratio of the peak intensity of the aberrated point spread function (PSF) to the ideal (diffraction limited) PSF.
- Modulation transfer function (MTF) which describes the transfer of contrast from the object to the image as a function of spatial frequency.
Additionally, distortion analyses and image simulations were conducted.
3.3. Results of modeling:
The following conclusions can be drawn from the optical simulations. Detailed results are contained in the corresponding slides (OpticalSimulation-abod-28-5-25-final.pdf).
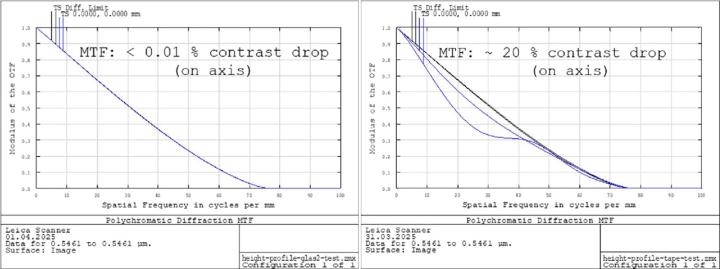
For the cover glass samples, nearly no noticeable deterioration in optical performance was obtained. There was no difference between the blank and the tissue samples relevant in praxis. Typically, contrast drop was below 0.1 % according to the modulation transfer function (MTF). In case of the tape samples, the simulations revealed a field-dependent degradation of image quality. MTF contrast showed local deteriorations in the range of 5-20 % for mid-range frequencies (Figure 20).
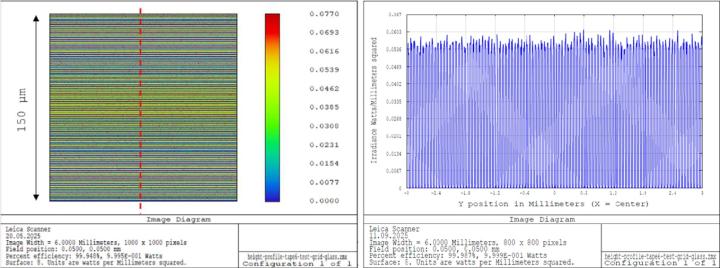
Since optical simulations of the entire field of view using real-world tissue photographs is quite difficult to assess, a digital resolution test chart was used instead and sample areas of 150 x 150 μm were investigated. The cutoff frequency of the scanner optics is about 1 μm according to the design data. Therefore, a line grid with a period of 1.5 μm appeared suitable. Typical pv-values and periods measured for the different cover media were used for the simulations.
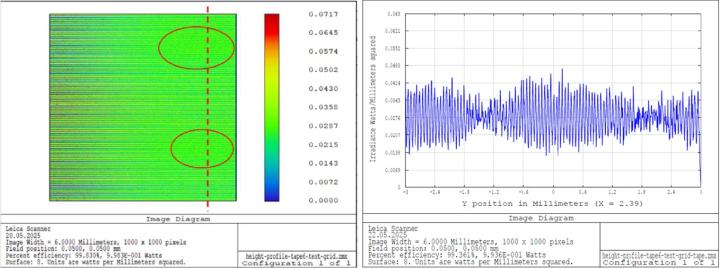
Image simulations for the cover glass demonstrate nearly constant resolution over the entire field (see Figure 21). For the cover tape, the simulations showed reduced contrast and decreased resolution in certain areas (see Figure 22). However, it should be noted that these effects only occur at the limit of the microscope's resolution.
In summary, it can be said that the cover glasses exhibit gentle bendings with relatively long periods, which has little effect on optical performance. In contrast, the tape surface are dominated by irregular corrugations with smaller periods. These disturbances can impair the optical performance at the limit of resolution in certain areas of the sample.
On a smaller scale, cover tape shows a much rougher surface than cover glass (compare Figure 1) which could cause light scattering and reduced contrast in the whole image. For evaluating the scattering effects quantitatively, advanced optical modeling would be required which was not part of the work packages. This could be investigated in a follow-up study, together with an examination of the fluorescence of different cover media and the impact on image quality.
4. Measurement of surface scratches and contamination
At the customer's request, an additional optical inspection of 3 blank samples of each cover medium was performed to detect contaminations and defects on the surface of the cover media. For this purpose, a LEICA INM300 wafer-inspection microscope with a 2.5x/0.07 objective was used. The defects were automatically recorded and categorized with the ImageJ image processing software according to ISO 10110-7.
The following steps were applied for all 6 samples:
- The samples were precleaned with optical wipes (Prosat PS-911, saturated with a solution of 70% isopropanol and 30% deionized water) and blown off with clean Nitrogen.
- A first microscopic defect-scan was performed.
- The samples were placed one week in a standard optical laboratory (without clean room classification) to simulate a common particle load.
- The samples were again blown off with Nitrogen
- A second microscopic defect scan was performed.
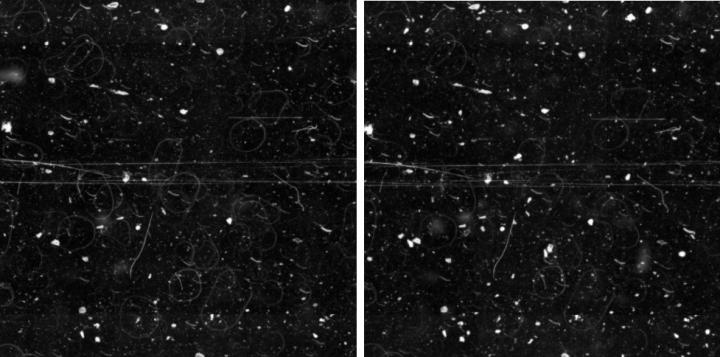
Representative defect maps (overlay projection of 2×2 mm sub photographs) of glass and tape samples before and after one week of exposure are shown in Figure 23 and Figure 24. Due to the large depth of field of the lens used (~ 120 μm), defects between the cover glass and the slide can also be seen (slightly blurred).
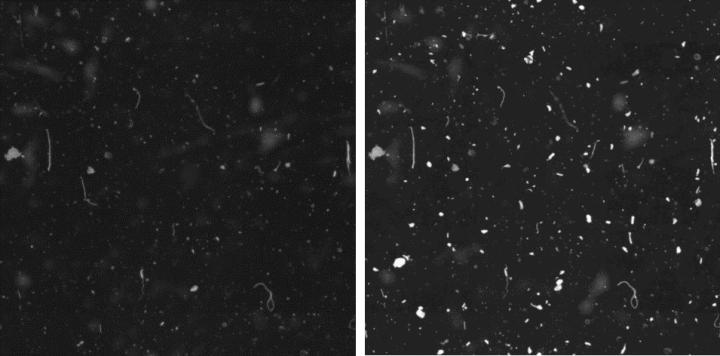
The following observations were made:
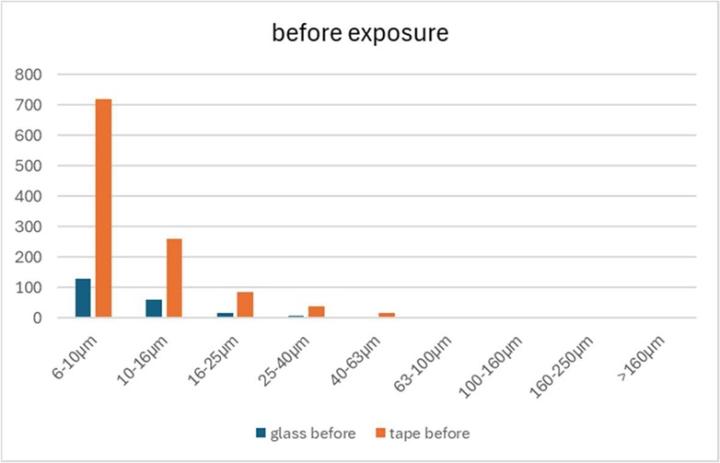
- The tape-covered samples already exhibited approximately five times more defects than the glass-covered samples before exposure to the laboratory air (Figure 25).
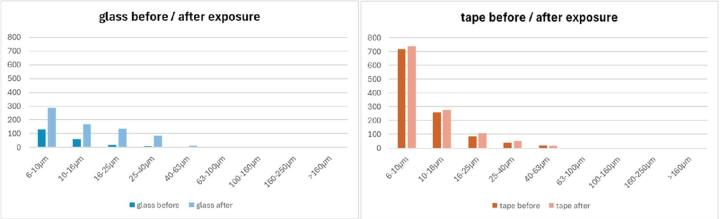
- After one week of storage in the laboratory, the samples covered with tape exhibited significantly less particle growth than the samples covered with glass (Figure 26).
- There was a certain number of scratches in the longitudinal direction of the cover tape samples that could not be seen on the cover glass samples (compare Figure 24).
The following limitations should be considered when interpreting the results:
- The number of samples (3x glass, 3x tape) is too small for a reliable statistical evaluation.
-
The “history” of the samples was not or only inadequately documented. This includes the mechanical handling of the samples as well as the treatment of the cover surfaces (mechanically or with cleaning agents).
This work package did not include an optical simulation related to the defects. However, since the scanner resolution is approximately 1 μm, deterioration in optical performance is to be expected for typical defect sizes in the micrometer range. Due to the shallow depth of field of the slide scanner optics (1-2 μm) this is particularly true for defects located between the cover medium and the slide (e.g. inclusions and bubbles).
5. Summary
The results of the comparative study can be summarized as follows:
Cover glass and tape media show clear differences in the surface texture. Firstly, tape surfaces show typical nodular micro roughness in the nanometer range. In comparison, glass is characterized by a very smooth surface, below measurement noise. Secondly, looking on a larger scale, tape samples show irregular waviness with periods of a few hundred microns. In contrast, glass samples are characterized by a more regular waviness with periods in the mmrange.
Both surface properties of the tape material can impair the image quality of the microscopic image: In the optical simulations, it could be shown that the tape corrugations will degrade contrast and resolution at the edge of the lens's resolution limit. Straylight caused by the micro roughness of the film material could decrease the contrast in the image. Since straylight simulations were not part of the project, no quantitative statements can be made in this regard.
From the R/T-measurements, it could be shown that Sakura cover film is not as ideally index matched to the object slide as the cover glass which can result in slightly higher spherical aberrations in the microscopic image at high numerical apertures.
Furthermore, the measurements reveal that the tape material has about 1-2 % higher optical losses compared to the cover glass which is probably due to stray light on the film’s rougher surface. In addition, unlike cover glass, increased absorption occurs for the tape starting below 350 nm.
Based on the ellipsometric measurements, we can conclude that no influence of birefringence on the image quality is to be expected for brightfield illumination microscopy at moderate numerical apertures as it is the case for the Leica slide scanner. However, these effects would become visible for high NA applications, specifically in connection with polarization microscopy.
Regarding surface defects, the tape samples exhibited approximately five times more defects than the glass-covered samples. Unlike the glass samples, scratches along the length of the tape samples were clearly visible under the microscope. However, tape surfaces exhibited significantly less particle growth than glass-covered samples during an exposure time of one week in the laboratory.
The results of the defect scans should be interpreted with caution because of the limited number of samples that were examined.
Sample size: 6 glass samples, including 2 blank samples, 3 with tissue sections (“Skin”, “Fatty Tissue”, “Biopsy”), and 1 raw material sample (coverslip). 7 tape samples, including 2 blank samples, 4 with tissue sections, and 1 raw material sample (tape)” as a footer.
Results reflect this single site evaluation with specific instruments, protocols, and sample mix. Outcomes may vary by laboratory environment, specimen types, and workflow. The study assessed technical/optical performance only and did not evaluate clinical diagnostic accuracy or patient outcomes
Related Content


Leica Biosystems content is subject to the Leica Biosystems website terms of use, available at: Legal Notice. The content, including webinars, training presentations and related materials is intended to provide general information regarding particular subjects of interest to health care professionals and is not intended to be, and should not be construed as, medical, regulatory or legal advice. The views and opinions expressed in any third-party content reflect the personal views and opinions of the speaker(s)/author(s) and do not necessarily represent or reflect the views or opinions of Leica Biosystems, its employees or agents. Any links contained in the content which provides access to third party resources or content is provided for convenience only.
For the use of any product, the applicable product documentation, including information guides, inserts and operation manuals should be consulted.
Copyright © 2026 Leica Biosystems division of Leica Microsystems, Inc. and its Leica Biosystems affiliates. All rights reserved. LEICA and the Leica Logo are registered trademarks of Leica Microsystems IR GmbH.