Tools Of The Trade: Multiplexed Digital Pathology


The more markers per slide, the more opportunities to get to the discovery endpoint faster, all while using less precious tissue. Watch the short, educational talks in which Prof. Aldo Scarpa, President of EPC, discusses the use of the newly launched BOND RX 7.0 Software. In his "Multiplexing Immunohistochemistry for Applied Research" talk he shares his insights around the software's potential for chromogenic multiplex IHC research by allowing up to 6 individual markers to be visualized on a single slide.
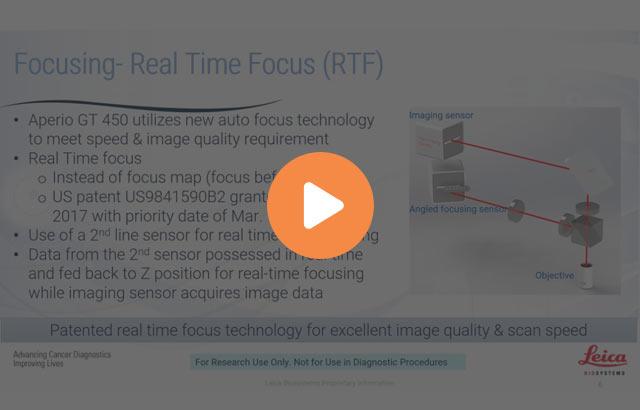
Dr. Rita Lawlor, on the other hand, explains how capturing histological and IHC images using Aperio digital pathology scanners creates a permanent and useful digital archive of critical information to enhance and facilitate analysis with artificial intelligence for tumor evaluation. Register to watch her talk "Digital Imaging for Biobanking and Artificial Intelligence".
Learning Objectives
- Develop an understanding of multiplex slide labeling and imaging techniques.
- Set up a multiplexing experiment, to choose the right antibody for the right tissue.
- Identify the unique types of research questions that can be addressed through multiplex imaging.
- Demonstrate how digital image analysis can be utilized to develop AI algorithms for tumor evaluation.
Webinar Transcription
Multiplexed Immunohistochemistry for Applied Research
Good afternoon. I'm speaking about the possibility of multiplexing immunohistochemistry for applied research. These are the disclaimers that Leica Biosystems furnished and in synthesis, I am responsible for all I am saying and presenting here and not Leica.
Transcriptomics: Microarray, RNAseq
Let's start with the problem. Only technologies furnish us a huge amount of data, and these data need to be distilled to fish out useful biomarkers, potential biomarkers. To do this, the best reproducible way is to use immunohistochemistry. Because this is the most familiar technique that we use in pathology, and this is the best way if we can use it to have technical and biological validation of potential biomarkers.
Technical and Biological Validation
The current methods for CD use of single cases in which each single marker is tested. However, we can optimize this approach by using tissue microarrays where we can use multiple samples in a single slide and we can use many markers on these many samples. The standard immunohistochemistry uses one marker per slide. We use a primary antibody and then a secondary antibody and one revolution system.
Multiplex Immunohistochemistry
We need more slides for more markers. In this case, if we want to multiplex immunohistochemistry, we have two choices, one is immunofluorescence. But this needs each antibody labeled with a different color, and this is going to be very expensive. The solution that Leica has been devising is the use of different antibodies. Each one is developed with a different color and a different revelation system, so one with red, one with green and so on.
Marginal-Zone Lymphoma
This is an example of the double immunohistochemistry, where we can see this. This is a bone marrow where you see the CD 20 positive cells which are B lymphocytes. If we use double staining, we know you can see on the right that the CD 20 positive B lymphocytes also have P53 immunostaining. This means that these B cells are neoplastic. This is one of the simpler application of multiplexing immunohistochemistry.
As you know, cancer is a tissue which is composed of cancer cells but also the microenvironment. Whatever we want to study and to research for imaging purposes, for molecular targeting, for example, we need to have the molecular characterization not only the cancer cells, but also with the microenvironment. Cancer cells may look different, but basically in pancreatic cancer they may belong to two different lineages. One is called the classical and the other one is called basal squamous. And these are characterized by specific expression of GATA 6. For example, with this one and the basal/squamous is characterized by the expression of the Delta NP 63, which is the much known as P40, but also cytokeratin 5 and 14. These two types may coexist also and may give rise to sometimes switching during progression of malignancy but also following treatment.
PDAC Cancer Cell Lineage
This is an example where we used 3 poly immunohistochemistry, so you can immediately recognize that on the left you can see a classical type of pancreatic cancer cells because they are positive to data 6 while on the right you will see a typical case which is a basal squamous because it is positive for CK Cytokeratin 5, which is in red here, and P40 which is in red in nuclei. Why is this important? Because we need to distinguish because they may respond to different therapies in different ways.
This is cancer cell identification, but we need also to understand how the microenvironment is composed, because trauma is composite and variable. You can find many types of cells, fibroblasts, immune cells, inflammatory cells. And you can appreciate in this light that you can see in an abundance trauma on your left, but there are no inflammatory cells. While on the right you have the same cancer cells producing mucus, as you can see here, but there are a lot of inflammatory cells. This is a simple case with morphology. But if we want to really characterize, we can validate this data using expression profiles. This is just one of the examples of expression profiles of ductal adenocarcinoma of the pancreas, where four different types were described, according to expression profiles, but the expression profiles are not only based on what cancer cells produce, but also on what microenvironment is formed of and produces. To make a long story short, let's take just these two subtypes, for example. As you can see, there are different profiles of genes expressed and this do correspond actually to these two cases that I showed you before, and if we apply Multiplex immunohistochemistry, we can see that there are differences in not only in the composition of the stroma, CD3 and FOXP3 are typical lymphocyte markers, CD68 and CD163 are typical of macrophages and you can see that not only the composition but also the distribution of the cells is very different.
Stromal Composition
There's an example of higher magnification where you can see there are a lot of CD3 T cells, but also you can see you can appreciate also the green which is the FOXP3 which corresponds to the T cell with regulatory functions D Rex. In this other case you can see a huge number of macrophages, mainly macrophages, most of which are CD163, which do correspond to M2 type macrophages, and this is one of the papers that has been published on the signature that we can find in ductal adenocarcinoma, and you can see that the prognosis is different. For example, in this research study.
This is another example where you can see the tumor. In this case the stroma is not intratumoral as you saw in the last slide. But here it is peri-tumoral and you can see that there are regions where there are accumulation of lymphocytes or macrophages which make different sites of microenvironment cells accumulation. This is the same example I showed you before. You can see that you can understand. Try to understand human biology, not only heterogeneity, also of the macro environment, but also the spatial arrangement of the microenvironmental cells, which in this case are basically intra-tumoral. You can see that the cancer glands here, for example here and the infiltration is all around the cancer cells is intra-tumoral.
Visualization and Spatial Definition of Immune-Cell Components
This is another example where you can see there is a huge number of lymphocytes and there is an intra-tumoral infiltration of these lymphocytes and at the higher magnification you can see that there are also some intraepithelial lymphocytes. It is basically very easy to get the results and to understand the localization, the spatial organization of the cancer cells and the microenvironment using Multiplex immunohistochemistry.
This is an additional example where you can see that there is a marker. In this case we used T cells, B cells, markers, CD24B cells, CD4, CD8 for T cells, but also PD L1 which is a marker which may suggest the possibility of experimental use. We model immunotherapy for example. And you can get all this information using multiplex immunohistochemistry.
To conclude multiplex immunohistochemistry is a very powerful tool for applied research, is a tool for technical validation, biological validation, experimental data and you can improve cost management and issues associated with material loss. For example, we do research very often on small biopsies and we use only one section for multiplex. And then it is the basis for the user artificial intelligence applications because the images can be interpreted by machine learning applications and algorithms. Thank you very much for your attention.
Digital Imaging for Biobanking and Artificial Intelligence
Good afternoon. My name is Rita Lawler and I would like to speak to you today on digital imaging for biobanking and artificial intelligence.
Here are my disclaimers. The presentation was created by me and all information represents my views and opinions as part of my research activity and have not been sponsored in any way.
As you know, the term biobank refers to an organized collection of well-characterized samples and data. One of the fundamental points is that the collections are done in an organized, and therefore, standardized or harmonized manner.
It is important to note, however, that while there is value to having large collections of high-quality samples, the exponential added value is in the information associated with the samples and the wealth of data produced from use of the samples. This includes the digital images of the samples in the Biobank, and there are two reasons for this.
The first reason is that the ability to create high-quality biobanks, particularly of cancer tissue, depends on the ability to trace the condition of the sample at every phase of use. As can be seen from the image here, biobanking cancer tissue requires taking multiple samples of the individual cancer to be treated in different ways. Because of the heterogeneity of the tissue and accurate representation of the morphology of the sample being used in any specific moment is essential in interpreting the resulting data. This is particularly so when areas of the tumor are selected for enrichment through microdissection. It is even more important when multiple, progressive tissue sections are taken given the potential heterogeneity throughout the tissue sample.
Therefore, a visual description of the material being placed in the biobank and subsequently of that being used can be facilitated not only by periodically creating HME slides at each moment of processing, but also by digitally acquiring the slides, therefore providing the biobank with an immediate evaluation of samples and verification for research purposes.
Because tissue microarrays are produced with drilled cores, it is also important here to acquire digital representation. As seen in the previous presentation, by digitally acquiring analogous immunohistochemistry stain slides, immediate comparison and evaluation is possible.
Here are some examples. We have clonal heterogeneity among different samples of the same tumor type. Here we have intertumoral morphological heterogeneity also showing molecular differences, which makes it important to have a record of which specific part of the tissue produced which molecular profile.
We come to an interesting example of primary tissue and patient derived xenografts, which as you can see overall respect the morphology of the patient’s cancer. But we had an interesting case where we used these center graphs for testing drug response and the same tumor implanted in different mice produced different responses regarding response to ABRAXANE and ABRAXANE combinations.
When we reviewed the digital images of the primary and the xenograft tumors, we identified that the original primary of undifferentiated osteoclast like cells remained in one xenograft, but had squamous differentiation in the other xenograft, hence producing the different treatment responses and why it was important to have the visual images to understand this result.
So why is all this important? We come to the second reason. Having a digital representation of the original tissue provides enormous opportunities for machine learning and artificial intelligence to assist histology evaluation, possible intratumoral heterogeneity and the microenvironment structure by analyzing not only the H&E slides but also the multiplexed stained slides that have been presented before. This can then be further developed through pathogenomics that associates histology data and images with genomic data to identify visual molecular patterns.
Enhanced deep learning computational analysis of pathology slides has already outperformed established morphological prognostic markers in some cancers, such as colorectal and breast. This feeds into machine learning and AI networks, promising to improve precision medicine. In the machine learning process, often the associations are weak. Therefore, the numbers need to be larger, requiring more data to strengthen their associations and inform the intelligence process. The implication is clear. The more well-characterized, high-quality samples and sets of integrated sample data and image biobanks are available, the faster research will advance.
Let's look at our machine learning and artificial intelligence. Of course, there are many different approaches that can be taken for whole image analysis. One of the most popular is using a tiled approach to analyze pixels in smaller areas of an image and perform per tile training to classify the tissue composition. This requires large training sets. Another approach is to perform cell segmentation using on supervised clustering based on intensity, morphology and spatial cell composition, which is what we will have a look at now.
Here's the example. Pathology can help in the prediction of pancreatic cancer subtypes based on digital slide evaluation. This is an example using cell segmentation and cell classification. Images are analyzed to classify the cells into tumor cells, stromal cells and immune cells. By using spatial data of these classified cells and performing neighborhood analysis that is analyzing the cell environment around each cell at a fixed diameter, we can identify several regions. In this example, we have identified three regions that are differentiated based on cancer, stromal and immune composition.
Each sample is then evaluated based on these regions, and here we have an example of high-stroma and low-immune. Here we have an example of high stroma and high immune, identifiable by the presence of CD3 CD163 and CD68 that was presented in the previous talk. And here is once again a familiar example, this time of low-stroma and low-immune. Of course, as can be seen here, given the heterogeneity of samples, these regions are not mutually exclusive in any individual tumor, but are usually a composite of the regions to varying degrees.
If we start with our basic slide. And we then apply cell classification to validate the unsupervised clustering, and we can set the area for neighborhood analysis to be as small or as large as we choose. We can then perform the clustering where each cell is automatically identified into epithelial and stromal tissue, which is important for spatial localization in the analysis and characterization of the tumor microenvironment.
Each object is then represented in the two-dimensional map, which is based on its proximity to similar and dissimilar objects that sets higher and lower probabilities respectively. We can then identify clusters of regions based on these probabilities. And this permits us to create a map, and we can then separate the tumor cells, which you can see in the top right from the immune cells which you can see in the bottom right. And this provides us with the representation of the densest location of the cells and provides us with an evaluation of how close they are to the tumor cells.
Finally, if we take the immunohistochemical stains and align them and layer them, we can once again sort them into regions of immune activity. In conclusion, the ability to digitally annotate tissue used within a biobank, and indeed the creation of an image Biobank, provides us with more accurate, quantifiable, and verifiable research results. Therefore, can be used for machine learning and artificial intelligence to evaluate cancer cell lineage, microenvironment, composition and spatial definition. Thank you.
Related Content
Leica Biosystems content is subject to the Leica Biosystems website terms of use, available at: Legal Notice. The content, including webinars, training presentations and related materials is intended to provide general information regarding particular subjects of interest to health care professionals and is not intended to be, and should not be construed as, medical, regulatory or legal advice. The views and opinions expressed in any third-party content reflect the personal views and opinions of the speaker(s)/author(s) and do not necessarily represent or reflect the views or opinions of Leica Biosystems, its employees or agents. Any links contained in the content which provides access to third party resources or content is provided for convenience only.
For the use of any product, the applicable product documentation, including information guides, inserts and operation manuals should be consulted.
Copyright © 2026 Leica Biosystems division of Leica Microsystems, Inc. and its Leica Biosystems affiliates. All rights reserved. LEICA and the Leica Logo are registered trademarks of Leica Microsystems IR GmbH.


